Combining image processing with visualization inspired environmental scientists to analyse X-ray and neutron data
Participants are pictured at LINXS’ balcony during the first day of the hackathon.
Combining image processing with visualization turned out to be a winning and much appreciated concept to educate new users in how to analyse and visualize data from X-ray and neutron tomography experiments. The two-day hackathon, which took place in October, was organised by the Environment and Climate theme at LINXS and gathered researchers from different countries and universities.
Helena Filipsson is Professor at the Department of Geology at Lund University, and member of the Environment and Climate theme. She says that the collaboration between LINXS, the QIM Center and InfraVis worked very well.
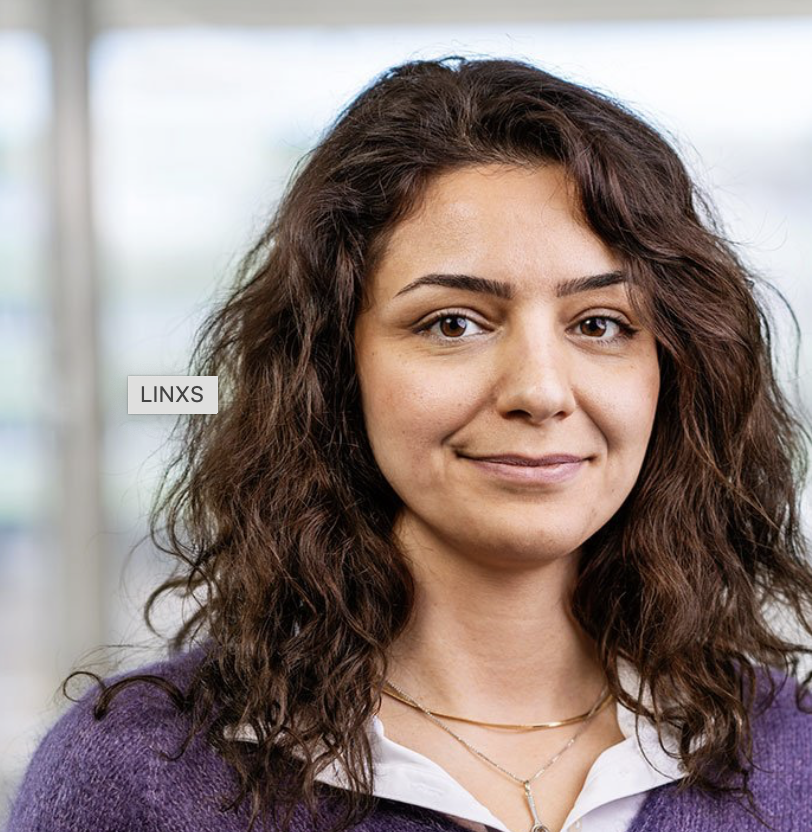
Behnaz Pirzamanbein is associate senior lecturer at the Statistics Department at Lund University.
– I am especially proud of the diverse mix of people we managed to bring in. It takes a lot of courage to attend this kind of event if you are new to image analysis, but this is exactly the group we wanted to reach, says Helena Filipsson, Professor at the Department of Geology at Lund University, and member of the Environment and Climate theme.
The event was co-organised with LINXS, the QIM Centre in Denmark, and InfraVis, a Swedish National Infrastructure with nine local nodes that provides advanced visualization services. The aim was to offer hands on sessions in imaging processing tools for synchrotron and neutron microtomography, and immersive visualization technologies including 3D rendering, Virtual Reality and Augmented Reality.
– You get an enormous amount of data when you perform experiments at a synchrotron, but we are not used to handle it in the environmental sciences. Reducing the threshold to work with data, and making people excited about what you can do with it, is crucial to increase the uptake and use of X-ray and neutron techniques, says Helena Filipsson.
Creating a pedagogical environment is important
Behnaz Pirzamanbein, associate senior lecturer at the Statistics Department at Lund University, was responsible for the tutorials during the first and second day. She has long experience in organising hackathons, and says it is important to create a pedagogical environment to encourage learning.
– In my experience it is good to start tutorials with something interesting; that shows what you can do with data. It gets people encouraged and motivated to learn. Then, step by step, you make it harder.
She adds:
– Many people are intimidated by programming, even though they have never tried it. We aim to show them the vast possibilities of using Python scripts, utilising a variety of useful libraries, once the basics are learnt. Python coding can automate the analysis of hundreds of samples, saving time compared to the tedious process of manual analysis.
Participants get help from Emanuel and Behnaz during the first day of the hackathon at LINXS.
Emanuel Larsson is Co-Director at LINXS, and InfraVis Node Coordinator at Lund University.
Added value for participants
LINXS Co-Director Emanuel Larsson notes that combining image processing with visualization tools proved very fruitful, and added a lot of value for the participants. Their reactions as they entered the VR-lab at Lund University, highlight how rendering data in a 3D format, through e.g., Augmented and Virtual Reality, including immersive virtual reality in a CAVE, can reveal hitherto unknown aspects of the sample or data set.
– It is great to see people looking at their own data in e.g., a CAVE. For the first ten minutes you just hear people saying wow, being completely in awe of what they see. But after that something happens: as people start to notice things in their data, they switch from amazement back to their scientific brain, says Emanuel Larsson, Co-Director at LINXS, and InfraVis Node Coordinator at Lund University.
The video shows participants entering the CAVE at Lund University as part of the two-day hackathon.
This reaction is exactly what Emanuel and his colleagues are after as they are aiming to highlight how getting data through an experiment is only the first step: using different tools for data analysis and visualization can render new insights, and they can also help researchers illustrate the importance of their work to other researchers and funders.
– Visualization can help different groups of researchers to find a mutual vocabulary. This is very helpful in science and also very important for collaborations, not least in fields that are new to X-ray and neutron approaches. It can take a long time to explain what you need if you come from different backgrounds, and visualization can help create a shared language, says Behnaz Pirzamanbein.
Learning how to use data is beneficial
Isaline Demangel is postdoctoral researcher at the Department of Geology at Lund University.
Postdoctoral researcher Isaline Demangel was one of the participants at the hackathon. Before the event she had never used Python before, but she was curious to try it out.
– I’m a young researcher, and I feel that there is so much more we can do with the technology that we have today. It is clear that you need another way to process the data you get at a synchrotron, rather than just traditional approaches, says Isaline Demangel, postdoctoral researcher at the Department of Geology at Lund University.
She learnt a lot during the two days, and she notes that the level was just right: with more detail she would have struggled.
– Now I have knowledge to do things myself with my own data. I’ve started seeing many benefits of automatisation, and this event gave me a good start to explore different software tools and programmes.


